Finalize your Data Story Presentation
Jan Lorenz
Storyboarding
Dykes’ Storytelling Arc
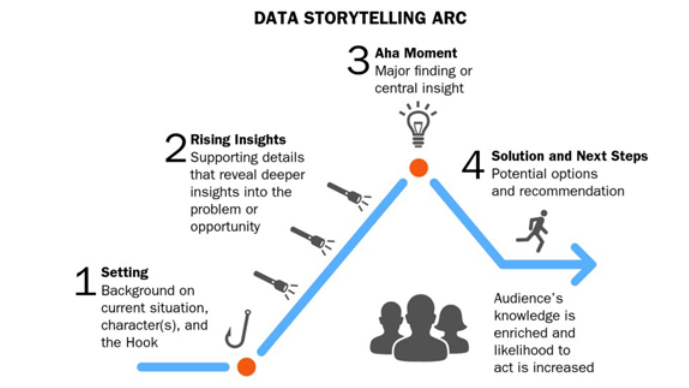
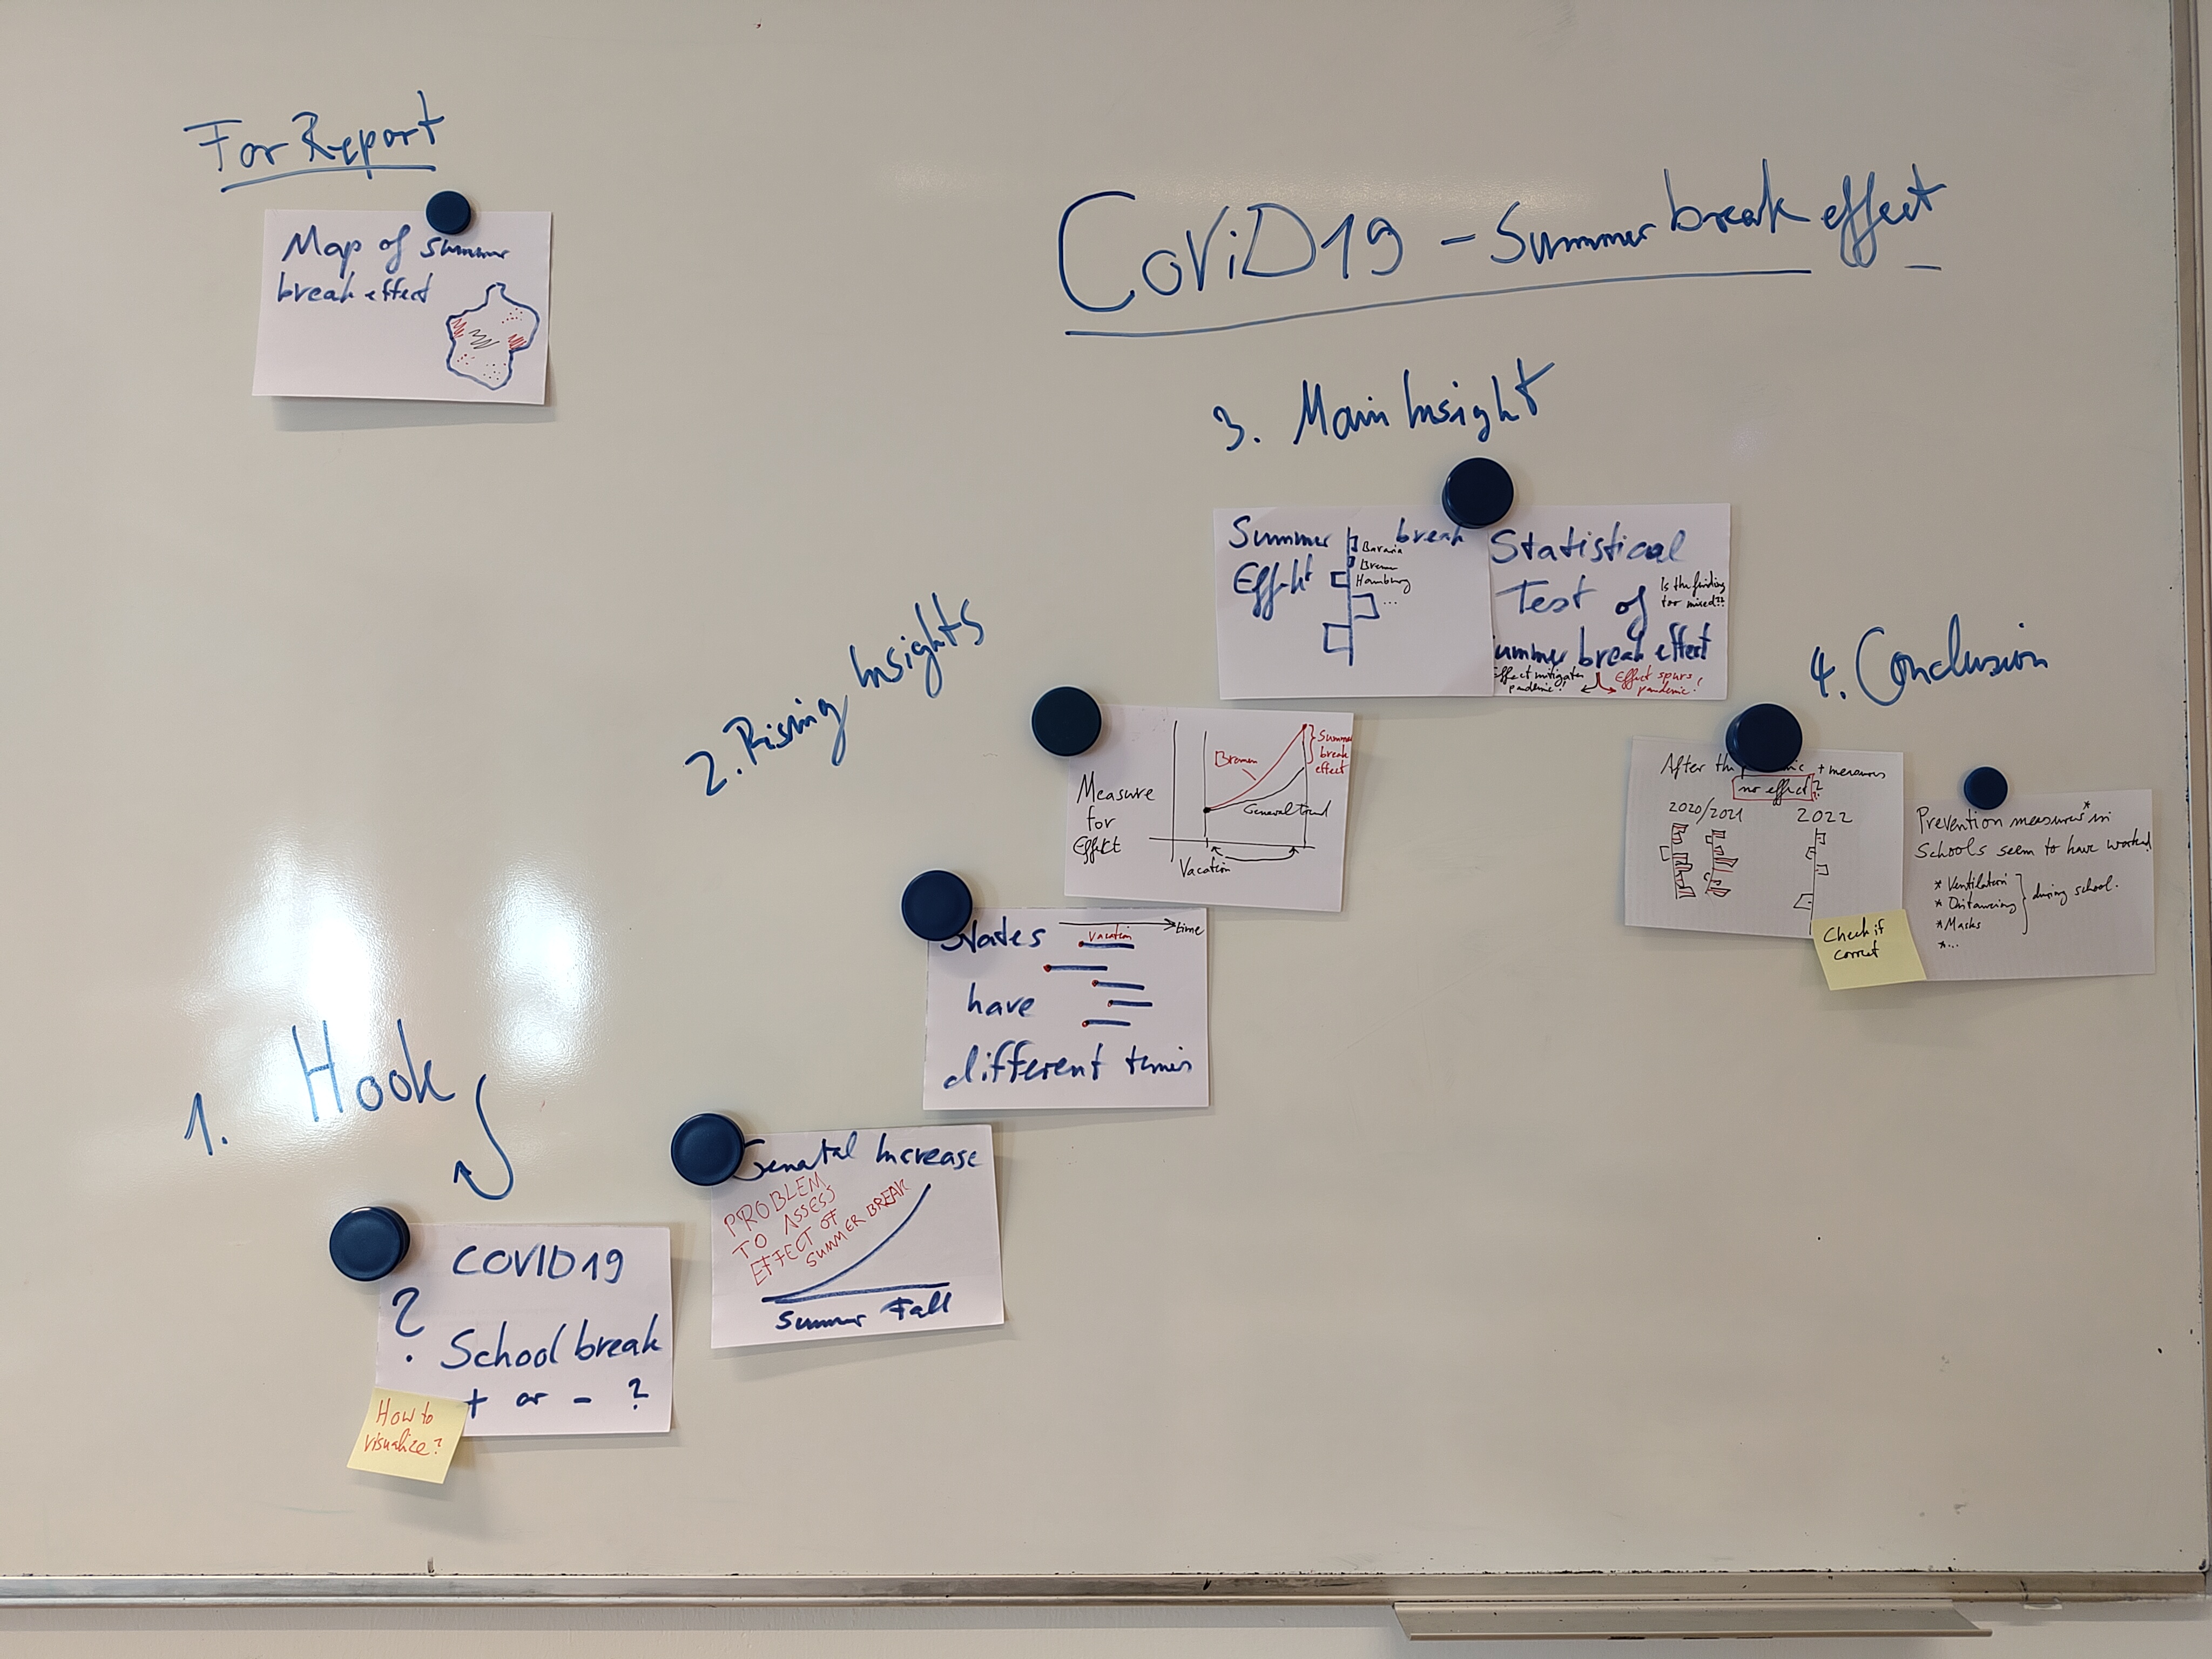
Storyboarding example
Storyboard for a presentation of the datastory The summer break effects on the CoViD-19 pandemic in Germany 2020-2022
Checklist: Datastory Essentials
Most important:
- What is your hook?
Make clear what the story is about. Provide context. - What is your main Point?
Select one among all the story points you have.
Then:
- What are the rising insights?
Story points to make one after the other from the hook to the main point. - What are the conclusion?
Depending on the assumed audience.
Visuals 1: Visualize the right data
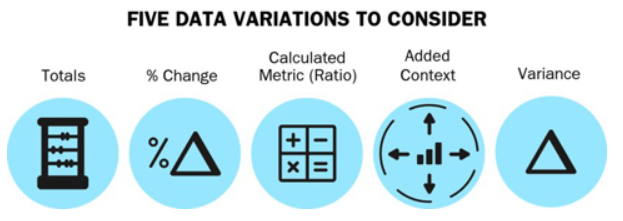
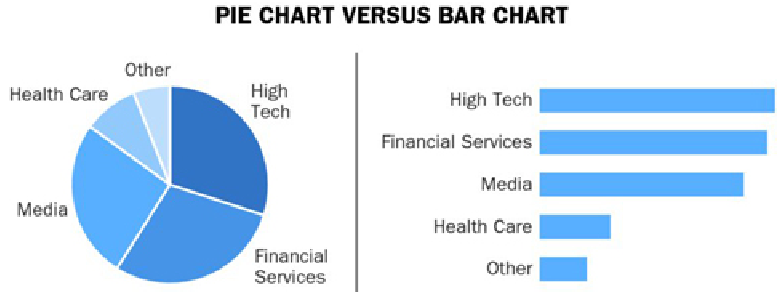
Visuals 2: Choose best visualization

Visuals 2: Graphical Perception
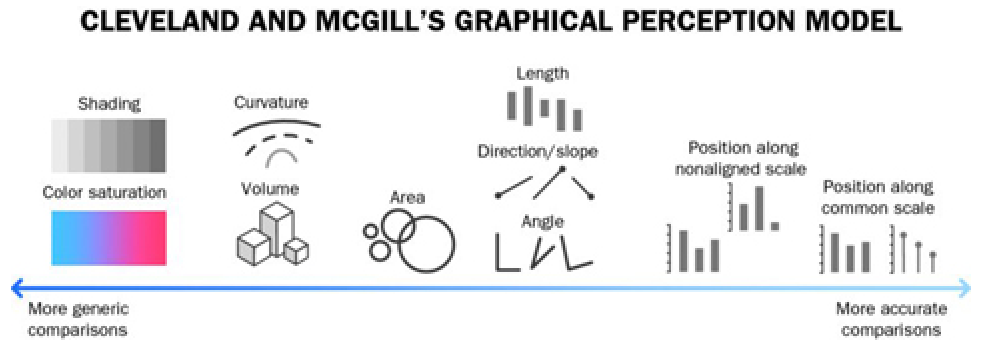
Visuals 2: Example Perception
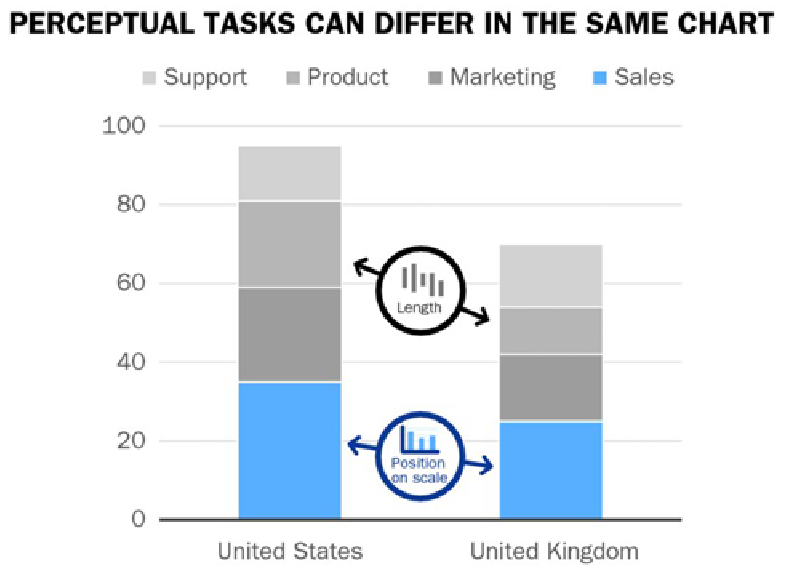
- The blue category can be compared more accurate easier than the gray ones
Visual 2: Pie vs. Bars
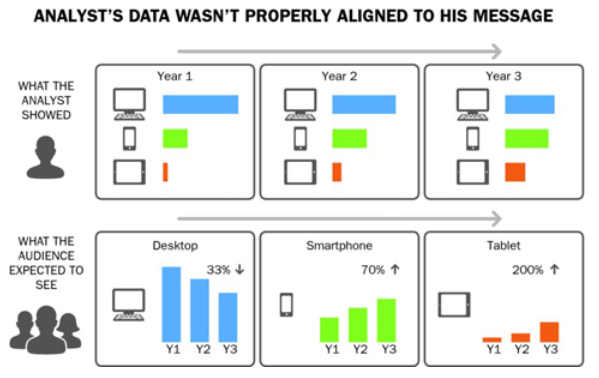
Visuals 3: Calibrate Visuals to Message
- Keep comparisons in close proximity
Put the things you compare close to each other - Provide a common baseline for comparisons
Can you provide a baseline for your comparison? - Ensure charts are consistent for comparisons
Do you use color consistently
Visuals 3: Example
Visuals 4: Remove unneccessary noise
- Remove surplus data
- Aggregate less important data
- Separate overlapping data
Should you facet a graphic?
Remove/reduce chartjunk
Visuals 5: Focus attention
- Which color palettes?
- Use color vs. gray
- Use text (or other) annotations
- Try to find explanatory and not purely descriptive titles
Visuals 6: Data approachable and engaging
- Make axis labels
- Consider direct labels
- Avoid vertical or diagonal text if possible
- Use simple axis increments, avoid scientific notation of numbers (no 1e6)
- Can you use meaningful guidelines, anchorlines, trendlines, shaded regions, gridlines
- Sort categories?
- Use transparency to show overplotting
- “Independent” variable on the x-axis
- …
Visuals 7: Instill trust in numbers
Be careful with:
- Truncated y-axis
- Inconsistent date intervals
- Inconsistent binning
- …
